Data Exchange Dashboard Criteria Screen |
Purpose |
The Data Exchange Dashboard criteria screen allows IRIS users to generate the Provider Data Exchange Dashboard report for their organizations which provides a summary of data exchange transactions sent to IRIS for a specified date range.
Functionality |
The Provider Data Exchange Dashboard report provides the summary of data exchange transactions and associated data/issues for a specified date range. In the event the organization selected has no transaction data, a message informing the user will be displayed on the report.
Generating the Report
1. Select the factors to use to generate the report.
2. The Organization(s) drop-down list will display:
§ The organization user is currently logged in under, and/or
§ The (sending) organization which previously/currently submitted data on behalf of the organization the user is currently logged in under. E.g. data is sent/submitted by another organization such as a parent or vendor organization.
NOTE: Please select the Organization sending/submitted the data to IRIS (e.g. the parent or vendor organization, which may not be the organization that owns the data or administered the immunization)
3. Select the Data type to be used on the report:
§ Click on the Production radio button to generate a report with production data.
§ Click on the Test radio button to generate a report with test data.
4. Report Option has “Provider Data Exchange Dashboard” report preselected and it is the only option.
5. Select the Report Data Range by entering the dates in the fields provided or by using the calendar icons to enter the dates. The date range must not exceed 31 days. There will not be any data prior to December 2017.
6. Click Generate Report button. The DX Dashboard Report Status page will be displayed.
§ You may leave this page while the report is generating and return to it later by using the “check dashboard status” link in the left menu panel.
§ To check on that report status without leaving the page, press the “Refresh” button. When the report is ready, you can click on the report name, which is underlined and in blue text.
Provider Data Exchange Dashboard Report Output |
Sample Output
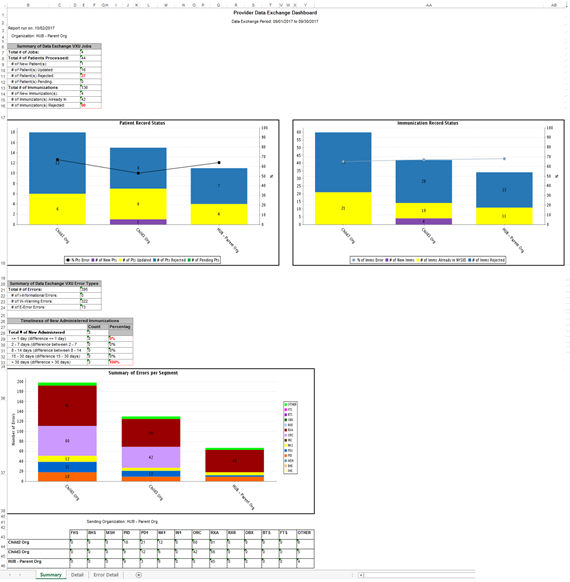
The Provider Data Exchange Dashboard report will be generated in an Excel spreadsheet format and have three tabs including Summary tab, Job Detail tab and Error Detail tab.
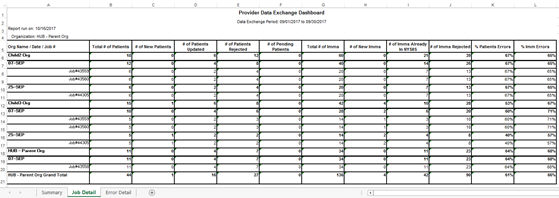
The first tab will have several summary tables and graphs related to VXU and QBP jobs, timeliness of data submission and types of errors. The second tab includes the detailed list of all the organization’s data exchange VXU jobs submitted in the specified date range. And the final third tab includes the detailed list of errors associated with the organizations data exchange VXU jobs submitted in the specified date range. The same information is found in the individual response files for each data exchange job.
Example Summary Report Layout:
Example Job Detail Report Layout:
Example Error Detail Report Layout:
